How Qntrl and Zoho Analytics can optimize your workflow efficiency
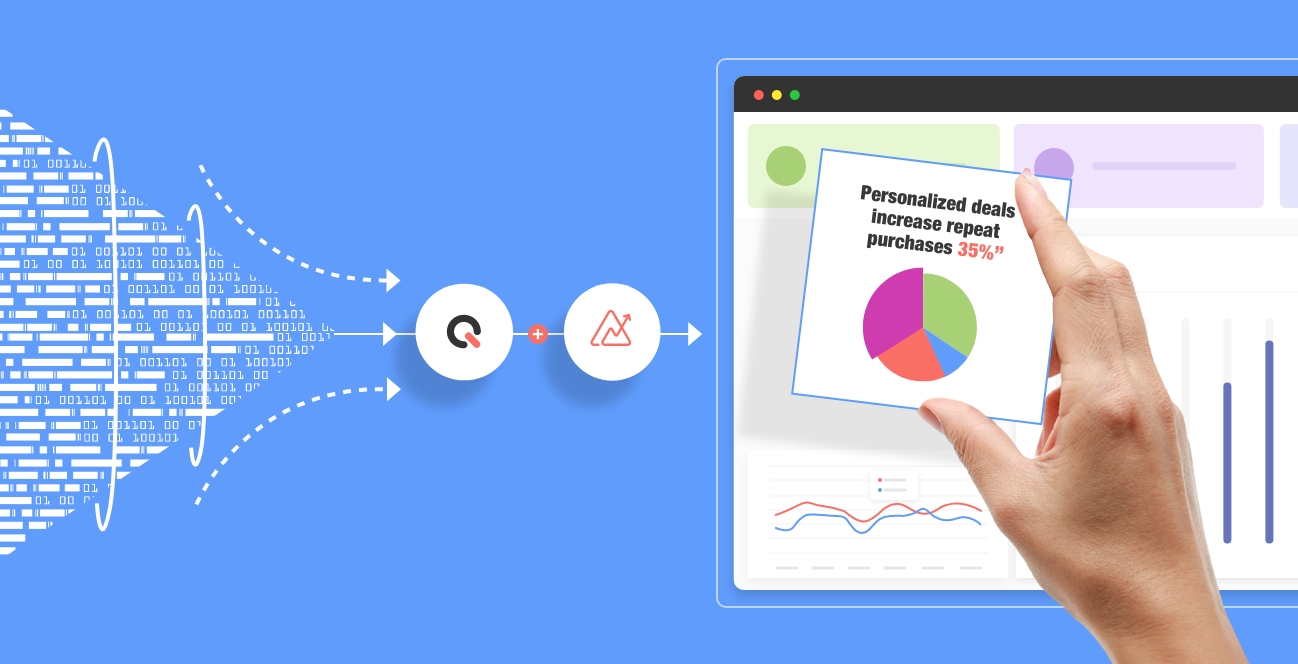
You’re sitting at your desk, trying to get a handle on your team's latest project, but there’s a problem—data. It’s scattered everywhere. Task completion times, performance metrics, and team bottlenecks are all tucked away in different systems. The info’s there, but it’s hard to make sense of it. What if you could pull all this data together and create a clear, actionable story? If you integrate Zoho Analytics with Qntrl you can!
No matter your department—operations, sales, customer support, or marketing—you all share a common need: timely, reliable, and insightful data. And that’s exactly what this integration delivers. The Zoho Analytics and Qntrl integration simplifies the way you view, interpret, and act on your workflow data with clear dashboards and insightful reports.
Let’s dive deep into how this integration can break down silos, eliminate data chaos, and provide your team with real-time insights to drive better decision-making and smoother workflows, all while addressing your unique challenges and objectives across various business functions.
Streamline production efficiency in the manufacturing industry
Stage-level insights into production efficiency
In a manufacturing plant, workflows in Qntrl represent each production stage, from material procurement to assembly and packaging. Using Zoho Analytics, production managers can generate reports on Stage Duration for each workflow stage, pinpointing bottlenecks and inefficiencies. For instance, if the Assembly Line workflow stage is frequently delayed, a Stage Duration Report can reveal whether delays stem from resource constraints, quality control, or equipment readiness. These insights enable managers to adjust resources precisely where needed, improving the production flow and reducing overall cycle time.
Predictive maintenance reports for minimizing downtime
By integrating machine service requests and downtime data into Zoho Analytics, manufacturing teams can create Maintenance Trend reports that highlight recurring maintenance requirements by machine type or shift. For example, if a critical machine frequently requires repairs during peak shifts, predictive analytics can reveal usage patterns and enable managers to proactively schedule maintenance, avoiding breakdowns that would halt production.
Quality control dashboards for real-time monitoring
With real-time dashboards in Zoho Analytics, quality control teams can monitor defect rates across different production batches. A Defect Source Analysis report allows managers to view defect patterns and analyze whether issues arise from raw materials, assembly processes, or specific machines. This data-driven approach supports immediate intervention, helping teams address quality issues promptly and maintain higher product standards.
Optimize loan processing and ensure compliance in the finance industry
Compliance monitoring for high-risk transactions
Compliance teams can use Zoho Analytics to generate Risk Assessment reports that track high-risk transactions flagged in Qntrl workflows. These reports show processing times, compliance bottlenecks, and approval durations, allowing teams to prioritize high-risk cases and ensure compliance without delay. For example, transactions flagged for additional scrutiny can be tracked to identify recurring patterns or delays, empowering compliance officers to refine protocols.
Loan stage duration reports for faster approvals
Financial institutions using Qntrl to manage loan applications can leverage Zoho Analytics to create Loan Processing Time reports at each approval stage. For instance, if the underwriting stage is frequently delayed, these reports can reveal whether the cause is resource-related, compliance hurdles, or document processing time. This transparency enables managers to streamline workflows by reallocating resources or implementing automated checks, reducing loan processing times and improving client satisfaction.
Customer response performance dashboards
Financial institutions can also create Customer Response Time reports in Zoho Analytics, capturing data from support tickets managed in Qntrl. This report can help managers understand if certain types of queries, such as billing issues, take longer to resolve and why. By identifying areas where response times lag, institutions can adjust staffing or offer additional training to improve customer satisfaction.
Simplify property management and maintain tenant relations
Maintenance request status reports for faster service
Real estate managers using Qntrl to track maintenance requests can create Maintenance Resolution Time reports in Zoho Analytics to monitor how long requests take to resolve. If HVAC issues at specific properties show frequent delays at the vendor approval stage, managers can adjust vendor management processes or staffing to streamline request resolution, enhancing tenant satisfaction.
Resource allocation dashboards across properties
With Zoho Analytics, managers can create Property Resource Usage reports to track resources like cleaning or security staff across multiple properties. For example, if one property consistently requires more cleaning resources, the data helps identify reasons and allows for strategic resource reallocation, avoiding overspend while ensuring adequate service at all locations.
Tenant service patterns analysis for improved retention
Zoho Analytics integration can help property managers identify tenant request patterns and common service requests and address recurring issues proactively. For example, if certain maintenance requests spike during specific months, predictive insights can help prepare resources in advance, enhancing tenant experience and retention.
Wrapping up
No matter your industry, Zoho Analytics and Qntrl bridge the gap between siloed data and strategic action, turning operational challenges into opportunities for growth. Whether you’re hunting down workflow bottlenecks, decoding team performance, or rethinking resource allocation, this integration lets you turn everyday operations into data-driven masterpieces. From IT service desks shaving hours off ticket resolution times to healthcare admins optimizing patient flow like a pro, the potential is staggering. And yet we’ve barely scratched the surface!
Curious to see what’s next? Check out everything this integration can do for your business—because the best stories always have a sequel! 😉
Enjoying your reading?
Enjoy organization and visibility too!
Qntrl can help you organise, control and improve production and projects in your team.